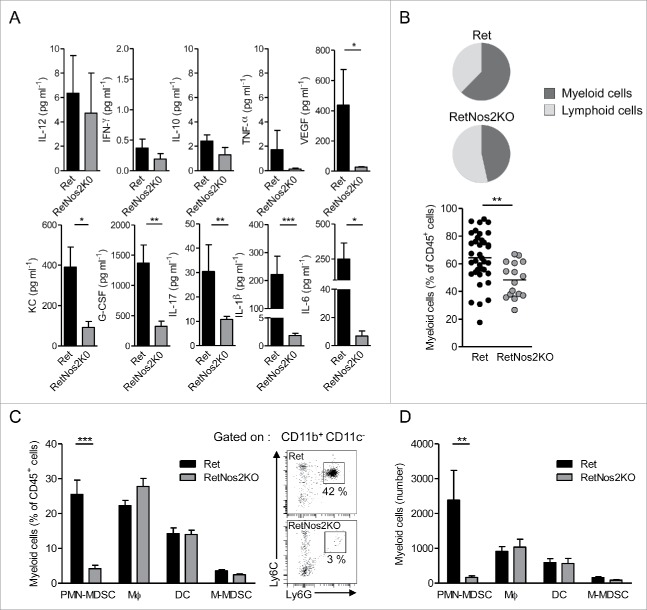
Figure 2.
NOS2 deficiency reduces PMN-MDSCs infiltration in primary tumors (A) Protein levels of indicated cytokines in primary tumors, from Ret (n = 14, except for G-CSF n = 11, IL-17 n = 10 and VEGF n = 8) and RetNos2KO (n = 8, except for IL-17 n = 6) mice, determined by ELISA and multiplex ELISA. (B) Proportions of myeloid cells among CD45+ cells within primary tumors of Ret (n = 35) and RetNos2KO (n = 16) mice (C,D) Dendritic cells (DC: CD11c+), macrophages (MФ: CD11b+CD11c-Ly6C−/lowLy6G-), monocytic MDSCs (M-MDSCs: CD11b+CD11c−Ly6ChighLy6G−) and PMN-MDSCs (CD11b+CD11c−Ly6ClowLy6G+) were analyzed by flow cytometry. Percentages (C) and absolute numbers (D) of myeloid cell subsets within primary tumors of Ret (n = 35) and RetNos2KO (n = 16) mice are shown (left). Representative dot plots of PMN-MDSCs staining (right), Data are pooled from at least three independent experiments. Each point represents individual mouse. Bars are mean ± SEM. *p < 0.05, **p < 0.01 ***p < 0.001 (Mann–Whitney test).

