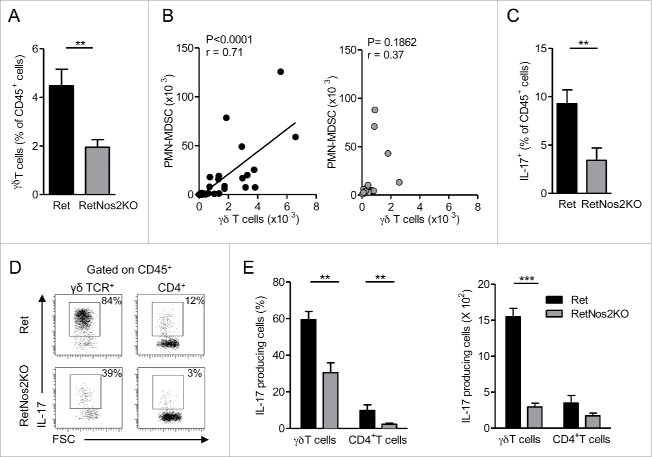
Figure 3.
NOS2 deficiency decreases IL-17-producing γδ Tcells (A) Percentage of γδ T cells among CD45+ cells in primary tumors of Ret (n = 9) and RetNos2KO mice (n = 11). (B) Correlation between the numbers of γδ T cells and PMN-MDSCs within the primary tumors of Ret (n = 33) (left) and RetNos2KO (n = 17) (right) mice. Each point represents individual mouse and line is linear regression. (C–E) IL-17 production assessed by flow cytometry on single-cell suspensions derived from primary tumors of Ret (n = 11) and RetNos2KO mice (n = 10) after PMA/ionomycin stimulation. (C) Percentage of total IL-17producing CD45+ cells. (D) Representative FSC/IL-17 dot plots are shown for γδ T cells and CD4+ T cells. (E) Percentage (left) and absolute number (right) of γδ T cells and CD4+ T cells producing IL-17. Bars are mean ± SEM. *p < 0.05, **p < 0.01, ***p < 0.001 (Mann–Whitney test A, C–E and Pearson correlation test B).

