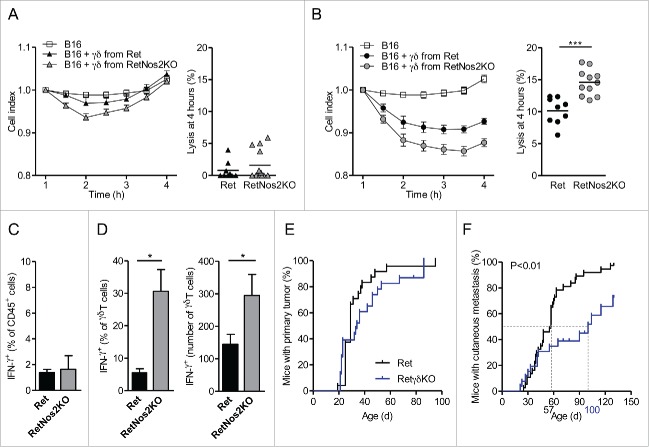
Figure 4.
NOS2 improves pro-tumor properties of γδ Tcells. (A, B) Cytotoxic activity of γδ T cells derived from Ret and RetNos2KO mice. B16 cells were seeded in wells of E-plates. γδ T cells stimulated with anti-CD28 (A) or anti-CD3 plus anti-CD28 (B) were added to a ratio of one γδ T cell for two B16 cells (see Methods). The inhibition of tumor cell proliferation was assessed by dynamically monitoring every 30 min on cell impedance. The graph (left) shows the normalized cell index values. The percent of B16 melanoma cell lysis (right) was calculated 4 h after addition of effector cells. Data are pooled from two independent experiments with 9 (non-stimulated and stimulated Ret), 11 (stimulated RetNos2KO) and 13 (non-stimulated RetNos2KO) replicates. (C,D) IFNγ production assessed by flow cytometry on single-cell suspensions derived from primary tumors of Ret (n = 5) and RetNos2KO mice (n = 4) after PMA/ionomycin stimulation. (C) Percentage of total IFNγ producing CD45+ cells. (D) Percentage (left) and absolute number (right) of γδ T cells producing IFNγ. (E,F) 4-mo follow-up of melanoma development from Ret (n = 37) and RetγδKO (n = 26) mice. Time courses of primary tumor (F) and cutaneous metastasis (F) onset. Mice were examined every 2 weeks. Data are mean ± SEM. ((A)and (B) left, C,D) except mean ((A)and (B) right). Each point represents one replicate ((A)and (B) right). *p < 0.05, ***p < 0.001 (Mann–Whitney test (A–C) and Mantel-Cox test (E,F)).

