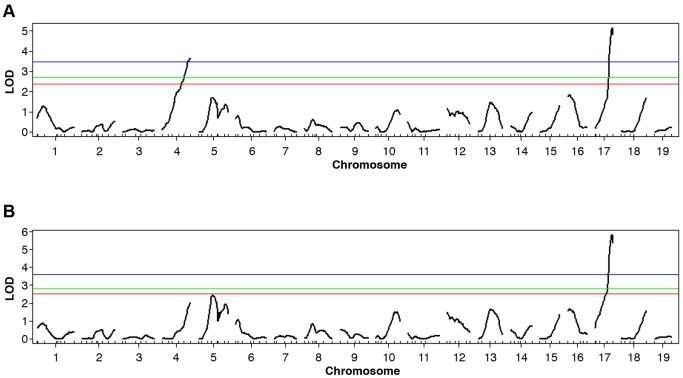
Fig. 5.
QTL analyses identify genetic regions contributing to high IOP in YBR mice. (A) A genome-wide scan using IOP values as a quantitative trait in N2 mapping progeny identified two significant QTLs: on chromosome 4 and chromosome 17. The blue, green and red lines indicate the significance thresholds at 1%, 5% and 10%, respectively. Both the chromosome 4 and chromosome 17 regions show LOD scores above the 1% threshold. (B) A genome-wide scan of only black mice (Tyrp1Y/B, with no iris disease) identified a significant QTL on chromosome 17.

