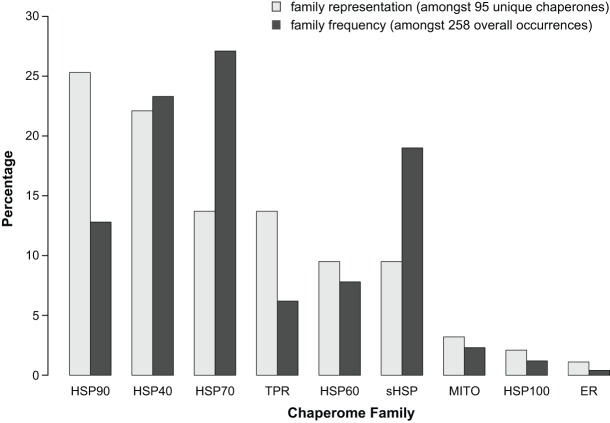
Fig. 2.
Representation of chaperome functional families. Percentage representation of individual chaperome families as defined in the legend of Fig. 1 amongst 95 uniquely identified chaperones and co-chaperones, and amongst 258 overall occurrences of all chaperones and co-chaperones in all studies highlighted in Table 1.

