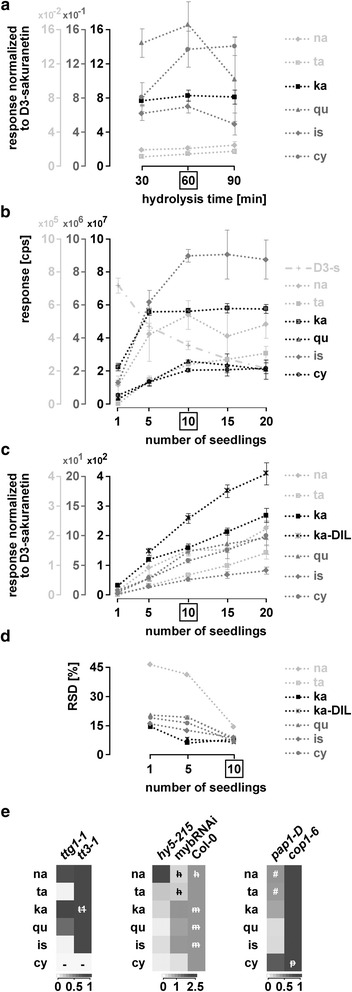
Fig. 5.

Adaptation of the method to seedlings. Analysis of seedlings by LC-ESI-MS-QTRAP(MRM). a D3-sakuranetin-normalized responses of flavonoids tested for different times of hydrolysis. b-d Selection of the optimal number of seedlings for the set of analysed flavonoids. b Responses of the different flavonoids tested, including D3-sakuranetin, for 1, 5, 10, 15 and 20 seedlings. cps: counts per second. c D3-sakuranetin-normalized responses from (b) and diluted samples for kaempferol. Please note that only quantifiable amounts are shown (Additional file 8: Table S14) d) RSD in percent for 1, 5 and 10 seedlings from (c). e Mutants. Heatmaps showing log2 transformed D3-sakuranetin-normalized responses (n = 3) relative to tt3-1, Col-0 and cop1-6. Statistics and mean normalized responses: Additional file 8: Table S14. Boxed: optimal number of seedlings according to these experiments. Error bars = STDEV. # LOD but not LOQ passed. -: LOD not passed. h, m, p and t1: no significant difference to the respective mutant. h: hy5-215, m: mybRNAi, p: pap1-D, t1: ttg1-1. ka-DIL: kaempferol-diluted
