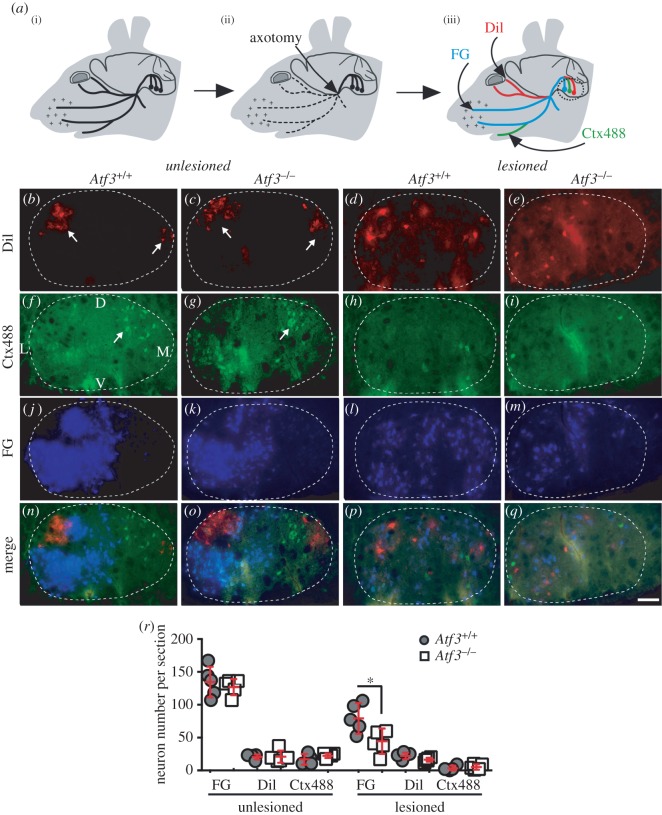
Figure 2.
Impaired axonal regeneration in Atf3 mutant mice. (a(i–iii)) The unlesioned facial nerve is depicted by a solid black line (a). Unilateral axotomy of the facial nerve was performed at the position marked by an arrow (a(ii)). Axon regeneration is quantified by injection of the fluorescent tracers DiI, FG and Ctx488 in the eyelid, whiskers and lower jaw, respectively (a(iii)). Upon muscle re-innervation by regenerating axons, the tracer is retrogradely transported to FMN cell bodies of the FN (black dotted circle). (b–e) In the unlesioned FN of wt (b) or Atf3−/− (c) mice, FMNs connected to the eyelid were localized in two domains (arrows in b,c). After 23 d.p.l., DiI back-labelled FMNs were dispersed over the FN in both wt (d) and Atf3−/− (e) mice. The number of DiI positive neurons was comparable between the unlesioned and lesioned FN, suggesting rapid re-innervation of the eyelid regardless of genotype (see r). (f–i) In the unlesioned FN of wt (f) or Atf3−/− (g) mice, retrogradely labelled Ctx488 positive FMNs were localized in a medio-dorsal FN quarter (arrows in f,g). Upon lesion, the number of Ctx488 positive FMNs was reduced, although comparably between wt (h) and ATF3-deficient (i) mice. (j–m) FG positive FMNs in unlesioned FN of wt (j) or Atf3−/− (k) mice were restricted to the lateral half of the FN. Upon lesion, FG positive FMNs were spread all-over the entire FN in wt (l) and mutant (m) animals. However, the number of FG positive neurons was reduced in Atf3−/− (m) compared with wt (l) animals (see r). (n–q) Merged images of individual channels presented in (b–m). (r) The average number of DiI, FG or Ctx488 positive FMNs per section in unlesioned or lesioned FN was quantified at 23 d.p.l. in wt (grey circles) and ATF3-deficient (white squares) mice. FG positive neurons were significantly reduced in lesioned FN of mutant compared with wt animals. Each circle or square in (r) represents one mouse. The dotted lines represent the margins of the FN. L, lateral; M, medial; D, dorsal; V, ventral. Data are presented as mean ± s.d. *p ≤ 0.05. Scale bar (b–q) = 100 µm.

