Figure 4.
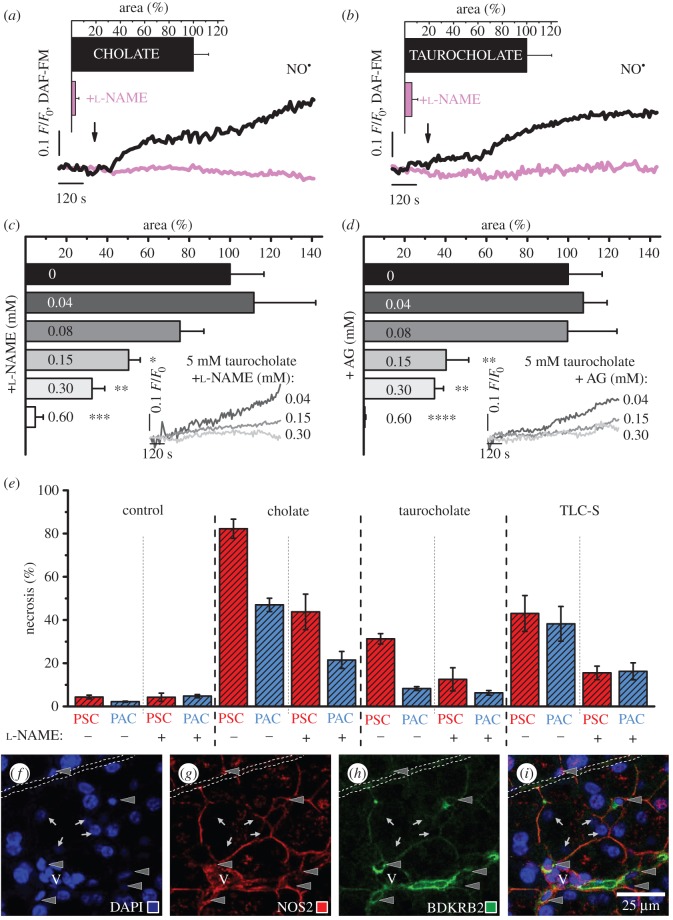
Nitric oxide synthase inhibitors diminish cytosolic nitric oxide signals and protect from necrosis. (a) Typical cytosolic NO responses evoked by 5 mM cholate in the absence (black, n = 8) or the presence of 0.6 mM l-NAME (pink, n = 9). Inset: bar chart (mean ± s.e.m.) comparing the areas under the response curves. (b) Typical cytosolic NO responses evoked by 5 mM taurocholate in the absence (black, n = 16) or the presence of 0.6 mM l-NAME (pink, n = 8). Inset: bar chart (mean ± s.e.m.) comparing the areas under the response curves (showed also in figure 4c). (c) Bar chart (mean ± s.e.m.) comparing the areas under the response curves of PSCs to 5 mM taurocholate, in the presence of 0.04–0.6 mM l-NAME (n ≥ 3). Inset: typical cytosolic NO responses of PSCs to 5 mM taurocholate in the presence of 0.04 (dark grey), 0.15 (grey) and 0.3 mM l-NAME (light grey); the responses are presented from the moment of taurocholate and NOS inhibitor administration. (d) Bar chart (mean ± s.e.m.) comparing the areas under the response curves of PSCs to 5 mM taurocholate, in the presence of 0.04–0.6 mM AG (n ≥ 3). Inset: typical cytosolic NO responses of PSCs to 5 mM taurocholate in the presence of 0.04 (dark grey), 0.15 (grey) and 0.3 mM AG (light grey); the responses are presented as in figure 4c. (e) Bar chart (mean ± s.d.) comparing levels of necrosis in the lobules under different experimental conditions. The lobules were treated with 5 mM cholate, 5 mM taurocholate or 0.2 mM TLC-S, the presence of 0.6 mM l-NAME is indicated with +; NaHEPES-treated lobules served as control. PSCs (dashed red) and PACs (dashed blue) were counted after triple staining of the lobules with fluorescent probes: Fluo-4, Hoechst 33342 and PI (four replicates, n = 20). See also electronic supplementary material, figure S3. ( f–i) Co-immunolocalization of the BDKRB2 and the NOS2 in mouse pancreas. ( f ) DAPI, (g) Ab anti-NOS2, (h) Ab anti-BDKRB2, (i) overlaid ( f–h). Scale bar, 25 µm. Arrowheads, PSCs; arrows, PACs; V, blood vessel; dash line, pancreatic duct. See also electronic supplementary material, figure S4.

