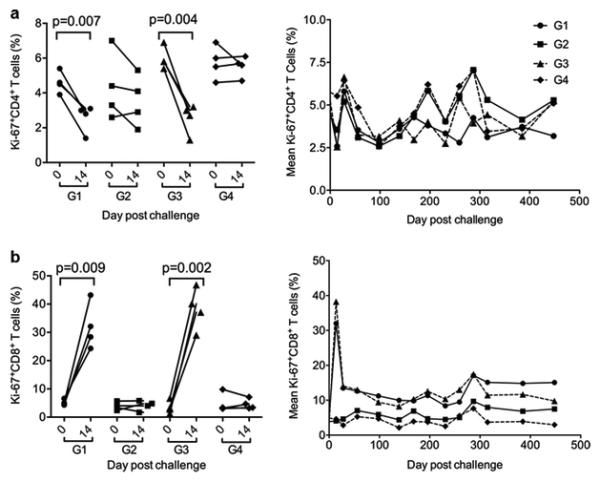
Fig. 3. Measurement of Ki-67+CD4+ and Ki-67+CD8+ T cells of all experimental macaques.

(A) Frequency of Ki-67+CD4+ T cells in each animal or mean frequency of Ki-67+CD4+ T cells in each group were measured at the acute phase of peak viremia on day 14 post infection (left) and overtime (right), respectively, by FACS analysis. (B) Frequency of Ki-67+CD8+ T cells in each animal or mean frequency of Ki-67+CD8+ T cells in each group were measured at the acute phase of peak viremia on day 14 post infection (left) and overtime (right), respectively, by FACS analysis. Paired student t test was used to analyze the indicated statistical significance.
