
Figure 2. Examples of Mild, Moderate, and Severe Reticular Densities on High Resolution Computed Tomography.
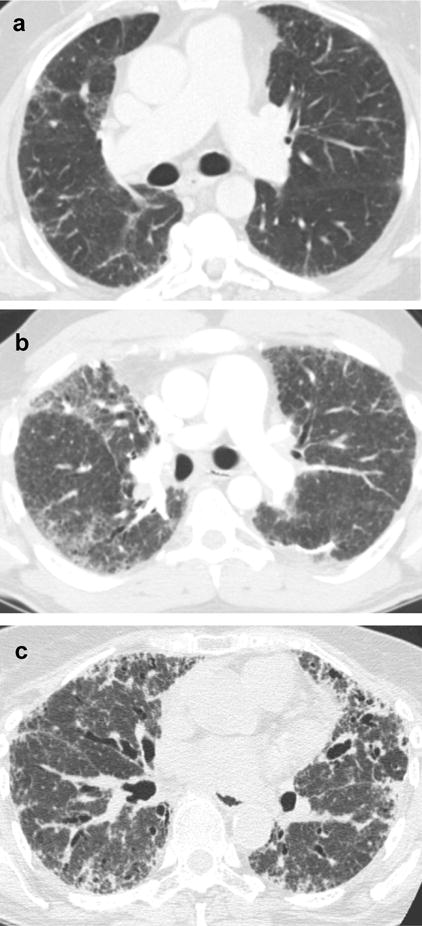
In panel a, mild reticular densities (white arrow marks example) occupy 25% or less of involved lobes, corresponding to a whole lung composite of 1 if all lobes are involved to a mild degree. In panel b, moderate reticular densities (white arrows mark examples) occupy 26–50% of involved lobes, corresponding to a whole lung composite between 1 and 2 if all lobes are involved to a moderate degree. In panel c severe reticular densities (white arrows mark examples) occupy 50% or more of involved lobes, corresponding to a whole lung composite of 2 or more if all lobes are involved to a severe degree.