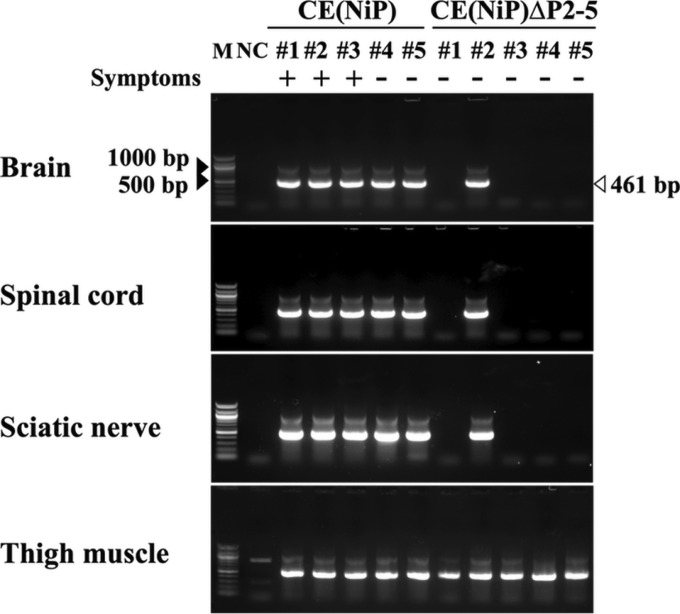
FIG 6.
Comparison of viral distribution in mice inoculated with CE(NiP) and CE(NiP)ΔP2-5. Tissues of mice infected with 106 FFU of each virus via the i.m. route were collected at 5 dpi and analyzed for the existence of viral genomic RNAs by RT-nested PCR targeting the N gene region (461 bp). M, marker; #1 to #5, identification numbers of mice; NC, negative control (each tissue i.m. inoculated with medium). Symptoms: +, mouse with symptoms such as body weight loss on the day of tissue collection; −, mouse without any symptoms on the day of tissue collection.

