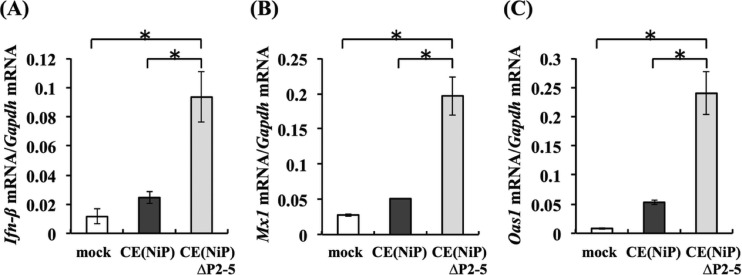
FIG 8.
Comparison of relative expression levels of IFN-related genes in muscle G-8 cells infected with CE(NiP) and CE(NiP)ΔP2-5. G-8 cells inoculated with each virus at an MOI of 1 were lysed at 24 hpi and used for RNA extraction. The expression levels of Ifn-β (A), Mx1 (B), and Oas1 (C) genes in each cell lysate were measured and are indicated as the number of copies of specific mRNA per copy of mouse Gapdh mRNA. All assays were carried out in triplicate, and the values in the graph are shown as means ± standard errors of the means. *, Significant difference at a P value of <0.01.

