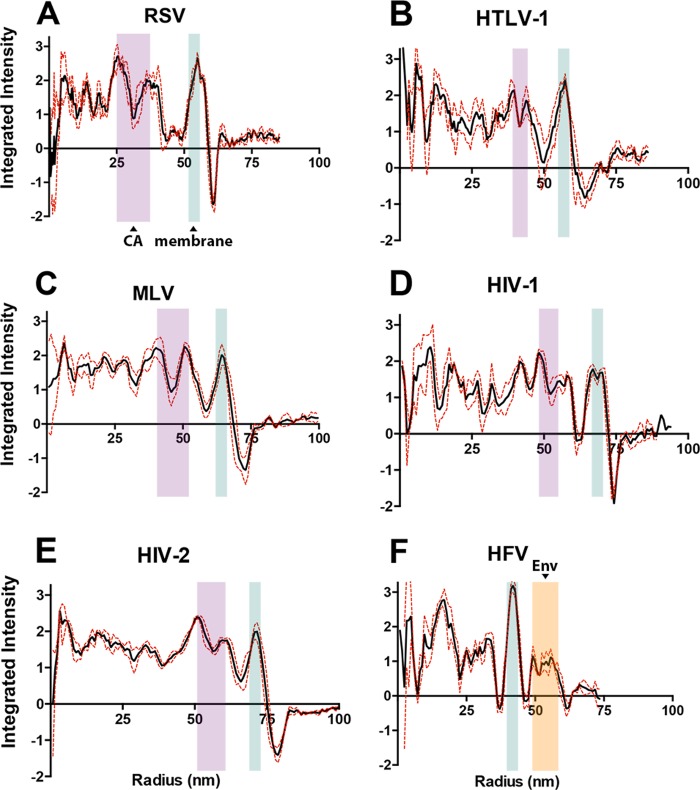
FIG 6.
Radial density profile analysis of retrovirus-like particles. The solid black line indicates the average retrovirus-like particle density measured. The dashed red line indicates the standard error of the mean. The radial density profiles shown were averaged from three particles of median size. (A) Rous sarcoma virus (RSV); (B) human T-cell leukemia virus type 1 (HTLV-1); (C) murine leukemia virus (MLV); (D) HIV-1; (E) HIV-2; (F) human foamy virus (HFV). As points of reference, the blue horizontal box indicates the location of the lipid bilayer density, the purple box indicates the location of CA densities, and the orange box indicates the Env density.

