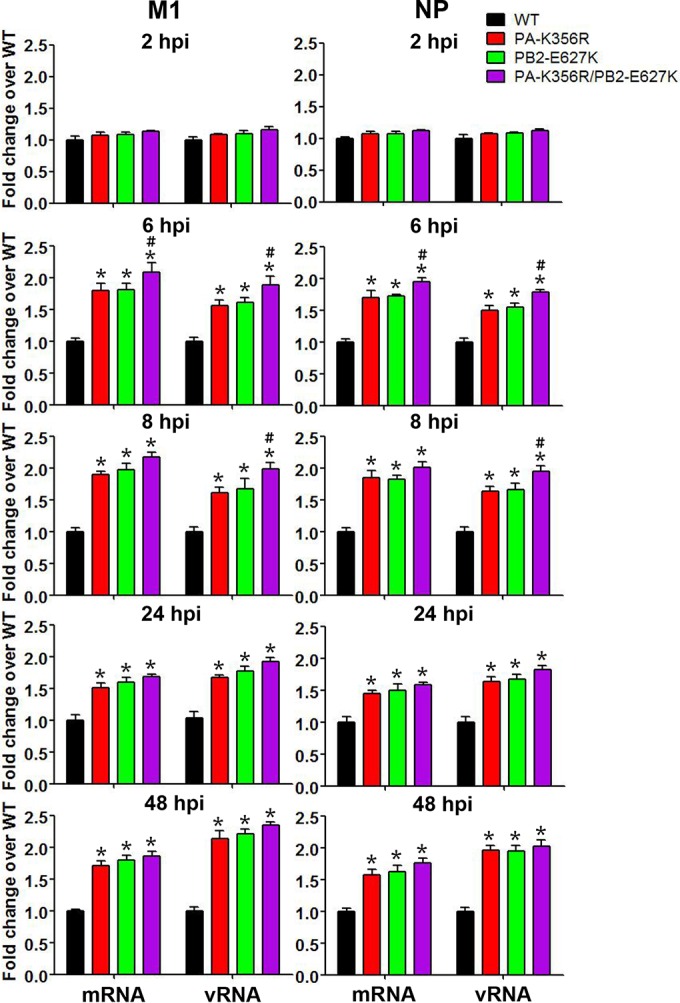
FIG 4.

Quantitative estimation of mRNA and vRNA levels of M1 and NP in H9N2 virus-infected A549 cells. A549 cells were infected with the indicated H9N2 mutant viruses at an MOI of 1.0 for 2, 6, and 8 h or at an MOI of 0.01 for 24 and 48 h. The mRNA and vRNA expression levels of M1 and NP from mutant viruses are expressed as fold changes in relation to the wild-type group. Data are presented as means ± standard deviations of results from three independent experiments. * indicates that the value is significantly different from that for the wild-type virus (P < 0.05 as determined by ANOVA), and # indicates that the value is significantly different from that for the virus with single mutation PB2-E627K (P < 0.05 as determined by ANOVA).
