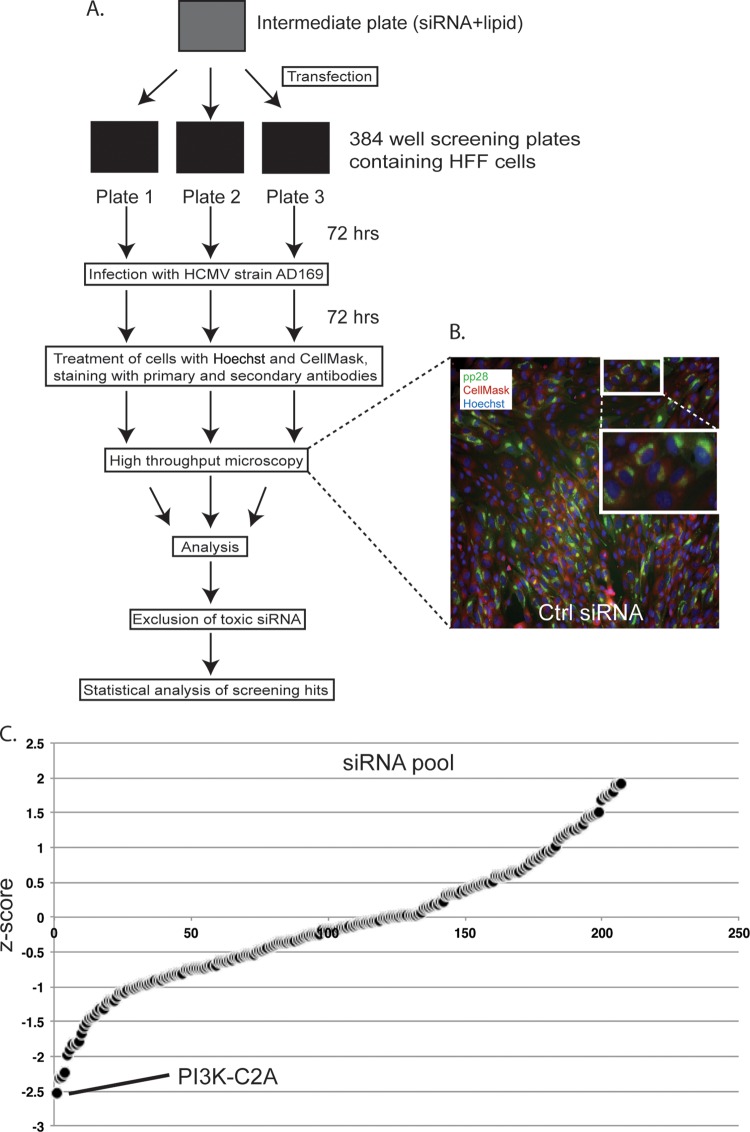
FIG 1.
High-throughput screening of siRNA. (A) Diagram of high-throughput screening process. (B) A representative example of a microscopy image from an Image Express Micro microscope of HFFs treated with Ctrl siRNA and infected with AD169. Cells were then treated with Hoechst 33342 (blue), Deep Red CellMask (red), and primary and secondary antibodies to detect HCMV pp28 (green). The large white box is an enlarged image of the area identified in the small white box. (C) Z-scores from the siRNA screen. The point that represents the Z-score for PI3K-C2A siRNA is indicated. A full list of siRNAs with Z-scores is shown in Table S1 in the supplemental material.

