
Figure 4.
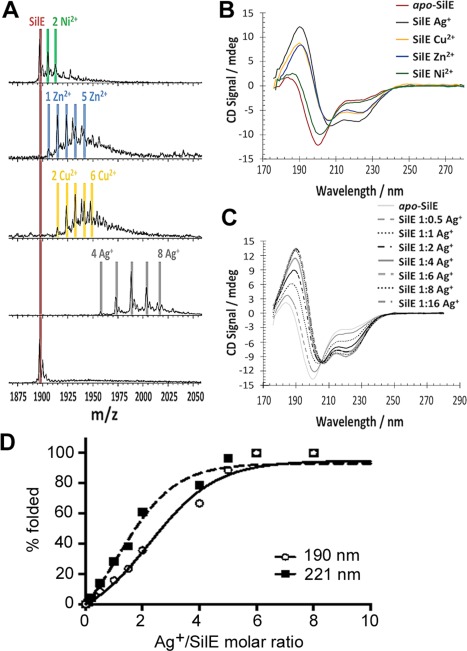
Determination of SilE metal ion‐binding.
After incubation with 2 mM: Ni2+, Zn2+, Cu2+ and Ag+.
A. native nano‐ESI MS for SilE (25 μM in 25 mM ammonium acetate, pH 7.0) showing the 7+ charge state. The digits together with the metal elemental symbol provide the number of atoms of metal ions bound to SilE (as deduced by the incremental mass increases) in the labeled peak. Apo‐SilE has molecular mass of 13,271 Da.
B. Far‐UV circular dichroism data (57 µM in 10 mM HEPES, 20 mM NaF, pH 7.5) exhibiting more alpha‐helical protein content when SilE is in the presence of Ag+ over the other divalent metal ions, especially Ni2+.
C. SilE titration at 75 µM in 10 mM HEPES, 20 mM NaF, pH 7.5, from 0 to 16 equivalents Ag+ using far‐UV CD. No change in signal following Ag+ addition beyond 6 Ag+ equivalents to SilE.
D. Plots of the CD signals as a function of the Ag+:SilE molar ratios at 190 and 221 nm produce sigmoidal curves indicative of co‐operative uptake of Ag+ ions by SilE.