
Figure 3.
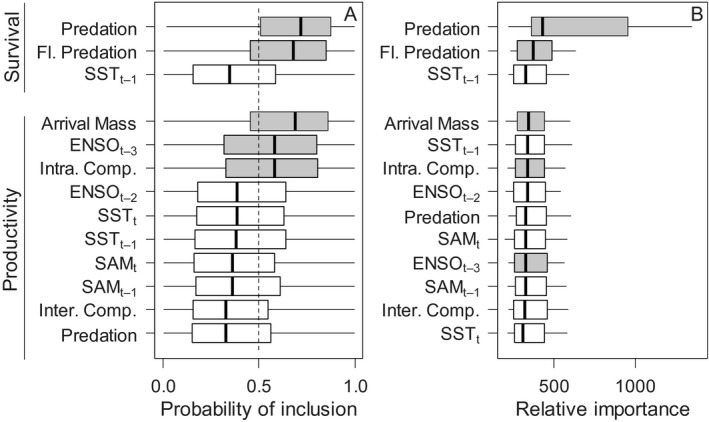
(A) The probability of each covariate influencing the population trajectory estimated using stochastic variable selection. Dashed line at 0.5; a covariate scoring predominantly above this will operate in more than 50% of model parameterizations. (B) The relative importance of each covariate in resolving the population trajectory; higher values and greater variability indicates more influence. Covariates are ordered within each demographic rate by the medianposterior estimate; sea surface temperature anomalies (SSTa); El Niño/Southern Oscillation (ENSO); Southern Annular Mode (SAM); time lags shown in subscript. Variables indicated as being included in the majority of model iterations based on variable selection are shaded gray; those excluded are white (box metrics: central line, median; box, interquartile range; whisker, 1.5 × inter‐quartile range).