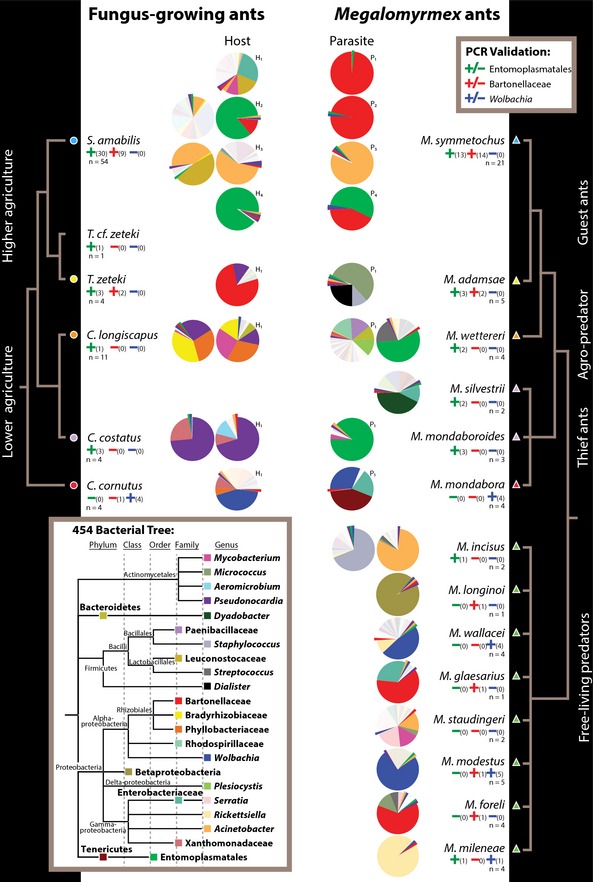
Figure 3.

Phylotype‐level microbiotas of Megalomyrmex predators and social parasites (right) and fungus‐growing ant hosts (left) as revealed by tag‐encoded FLX 454 pyrosequencing, with PCR validations for Entomoplasmatales, Bartonellaceae and Wolbachia given as +/− signs in, respectively, green, red and blue, with the number of confirmed infected nests in parentheses relative to the total number of nests screened (n). Simplified phylogenetic trees obtained from Schultz & Brady (2008) for the attine host ants and from morphological and molecular studies (Brandão 1990; Adams 2008; Longino 2010) for Megalomyrmex are given towards the left and right side. The terminal branches of the phylogenies are coded with triangles and circles and coloured corresponding to Fig. 1. Pie charts represent ant microbiotas, plotting only the 25 bacterial phylotypes that were either most abundant across all samples or particularly abundant in single samples (for complete operational taxonomic unit (OTU) assignments, see Table S2, Supporting information), with phylogenetic relationships given as inset towards the bottom left. The top five bacterial phylotypes were enlarged and pulled out of the pies when only present at low relative abundances. Shades of white or light grey are rare bacterial taxa that are not included in the tree of the 25 most abundant phylotypes. Hosts and parasites that were inhabiting the same nest upon sample collection are marked with either H (hosts) or P (parasites) and numbered with subscripts to identify specific joint nests. Pies without numbered P and H annotations represent ant colonies that were not associated upon collection, hosts that were not parasitized, or free‐living Megalomyrmex predators.
