
Figure 5.
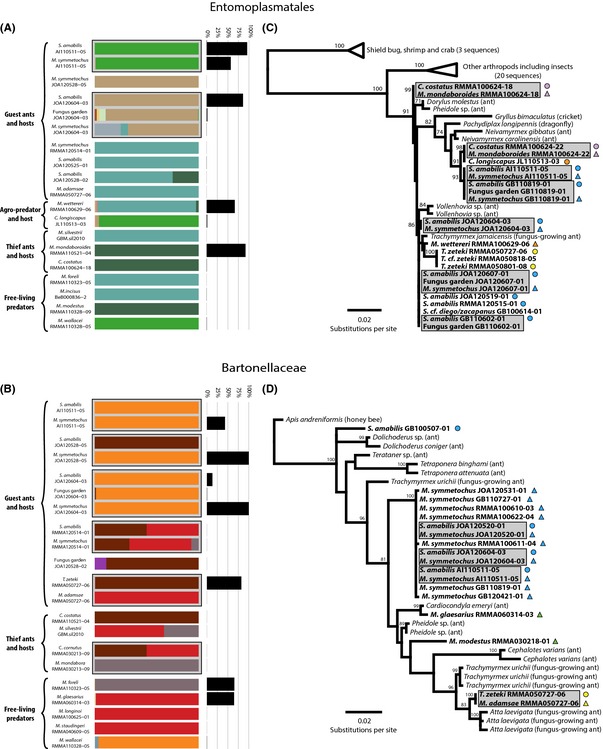
Distribution of 16S rRNA genotypes as identified by oligotyping from the reads extracted from the 454 16S rRNA pyrosequencing data set (A and B), and phylogenetic relationships (C and D) of Entomoplasmatales and Bartonellaceae. Colours in the stacked bars represent the relative proportions of the different genotypes found in each sample for Entomoplasmatales (A) and Bartonellaceae (B), while black bar charts show the overall abundance of Entomoplasmatales (A) and Bartonellaceae (B) relative to the total microbiota in each sample. Maximum‐likelihood phylogenies of Entomoplasmatales (C) and Bartonellaceae (D) are based on c. 970 bp of 16S rRNA amplified from samples collected for the present study (bold faced text) or closely related strains from GenBank (normal text), and coded with triangles and circles coloured by specific host–parasite associations with free‐living Megalomyrmex in green as in Fig. 1. Values above the nodes represent support ≥50 after 1000 bootstrap replicates. In all panels, grey‐shaded cells highlight hosts, parasites and fungus gardens that were collected from the same nest.