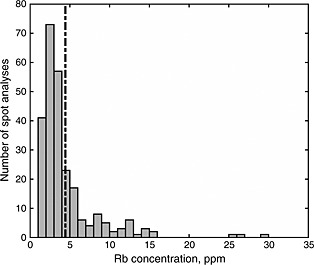
Figure 2.

Rb concentrations inferred for spot analyses of the Duluth Gabbro. The histogram shows concentrations for only the spots analyzed during the raster of random positions on the sample; revisits to the vicinities of spots with particularly high Rb/Sr ratios are not included. The mean Rb concentration inferred for our sample is 4.4 ppm (dashed line), which is similar to the lowest Rb concentrations reported in the Duluth Gabbro by Faure et al.37
