. 2015 Apr 9;122(9):1191–1199. doi: 10.1111/1471-0528.13398
© 2015 The Authors. BJOG An International Journal of Obstetrics and Gynaecology published by John Wiley & Sons Ltd on behalf of Royal College of Obstetricians and Gynaecologists.
This is an open access article under the terms of the Creative Commons Attribution‐NonCommercial‐NoDerivs License, which permits use and distribution in any medium, provided the original work is properly cited, the use is non‐commercial and no modifications or adaptations are made.
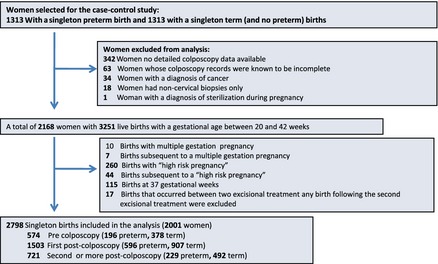
Figure 1.

Inclusions and exclusions from the study.
