
Figure 1.
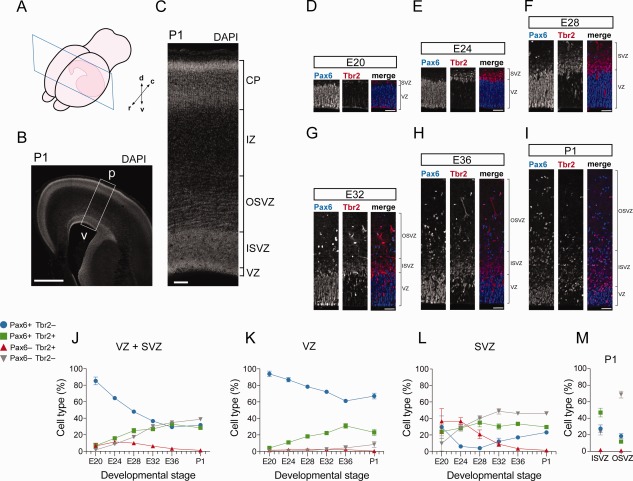
Pax6‐ and/or Tbr2‐expressing cell subpopulations in the germinal zones of developing ferret neocortex. A: Cartoon showing a coronal section of a P1 ferret hemisphere, with the rostrocaudal (r–c) and dorsoventral (d–v) axes as indicated. B,C: DAPI staining of P1 ferret neocortex (100‐μm coronal vibratome section, stack of four 2.5‐μm optical sections). The box in B indicates the area shown at higher magnification in C. p, pial surface; v, ventricle. D–I: Double immunofluorescence for Pax6 (blue in merged images) and Tbr2 (red in merged images) on 20‐μm coronal cryosections of ferret neocortex at the indicated stages (single 1‐μm optical sections). J–M: Quantification of Pax6+ & Tbr2− (blue), Pax6+ & Tbr2+ (green), Pax6− & Tbr2+ (red) and Pax6− & Tbr2− (gray) nuclei in the VZ+SVZ (J), VZ (K), SVZ (L), and ISVZ vs. OSVZ (M) of ferret neocortex at the indicated developmental stages, each expressed as percentage of total nuclei in the respective zone(s) as determined by DAPI staining. Data are the mean ± SD (E20, n = 8; E24, n = 4; E28, n = 4; E32, n = 5; E36, n = 4; P1, n = 8). Scale bar = 1 mm in B; 100 μm in C; 50 μm in D–I.