
Figure 2.
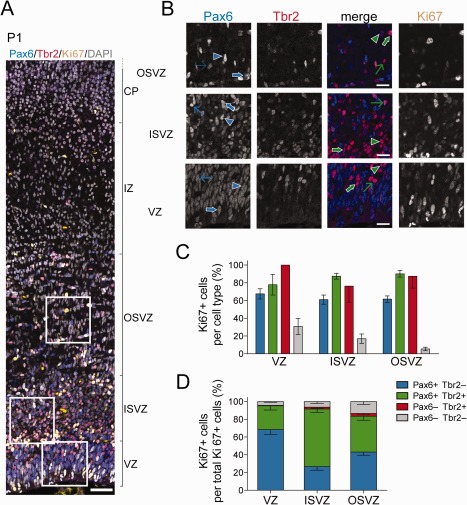
Proportion of cycling progenitors among the various cell subpopulations in the germinal zones of P1 ferret neocortex. A: Triple immunofluorescence for Pax6 (blue), Tbr2 (red), and Ki67 (yellow), combined with DAPI staining (gray), on a 20‐μm coronal cryosection of P1 ferret neocortex (1‐μm optical section). Scale bar, 50 μm. B: Higher magnification of the areas indicated in A, showing immunofluorescence for Pax6 (first column, blue in merged images), Tbr2 (second column, red in merged images), Pax6 & Tbr2 (merge, third column), and Ki67 (fourth column). Selected cells are indicated as follows: blue arrowheads, Pax6+ Tbr2− Ki67−; thin blue arrows, Pax6+ Tbr2− Ki67+ (low Ki67 intensity); thick blue arrows, Pax6+ Tbr2− Ki67+ (high Ki67 intensity); green arrowheads, Pax6+ Tbr2+ Ki67−; thin green arrows, Pax6+ Tbr2+ Ki67+ (low Ki67 intensity); thick green arrows, Pax6+ Tbr2+ Ki67+ (high Ki67 intensity). C: Quantification of the percentage of Ki67+ cells within each Pax6± & Tbr2± cell subpopulation (see key) for each of the three germinal zones of P1 ferret neocortex. Data are the mean ± SD (n = 8). D: Quantification of the percentage of the Ki67+ cells of each Pax6± & Tbr2± cell subpopulation (see key) within the total Ki67+ cells for each of the three germinal zones of the P1 ferret neocortex. Data are the mean ± SD (n = 8). Scale bar = 50 μm in A; 20 μm in B.