
Figure 5.
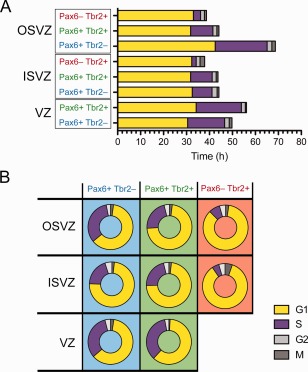
Cell cycle parameters of P1 ferret neocortical progenitors. A: Average duration of cell cycle phases (G1, yellow; S, purple; G2, white; M, gray) for the indicated progenitor type and germinal zone. B: Proportional contribution of cell cycle phases to total cell cycle for the indicated progenitor type and germinal zone.