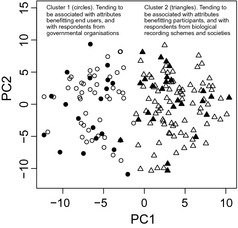
Figure 2.

The principal components analysis of responses in which a participant with experience of monitoring biodiversity in the UK ranked the top 10 attributes for improved monitoring of biodiversity change. Two clusters were identified in the responses (circles and triangles), showing strong association with the first principal component (PC1; Table 2). Filled symbols represent responses from the invited participants; others are from those responding to the open invitation to be involved.
