
Figure 3.
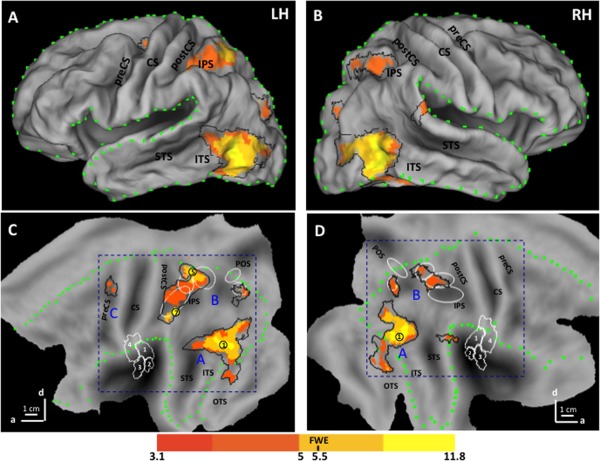
SPM corresponding to the activation map for observation of manipulation: left hemisphere (LH) on rendered brain (A), inflated Caret brain (B), and flatmap (C) and the right hemisphere (RH) on flatmap (D). Color code indicates t score for the conjunction of contrasts action versus static and dynamic controls (see inset); yellow dots and numbers: local maxima reaching FWE corrected level (Table 2); Blue letters A, B, C: three levels of AON; black outlines P < 0.01 uncorrected level; green dotted lines: border of lateral view in A and B; white ellipses from rostral to caudal: phAIP, DIPSA, DIPSM, POIPS, VIPS [Georgieva et al., 2009]; white contours OP1‐4 regions [Eickhoff et al., 2007]. Scale indicates anterior (a) and dorsal (d) directions; one branch indicates 1 cm. Abbreviations: Cgs, cingulate sulcus; SFS, superior frontal sulcus; IFS, inferior frontal sulcus; PreCS, precentral sulcus; CS, central sulcus; PostCS, postcentral sulcus; IPS, intraparietal sulcus; POS, parieto‐occipital sulcus; STS, superior temporal sulcus; ITS, inferior temporal sulcus; OTS, occipito‐temporal sulcus; ColS, collateral sulcus.