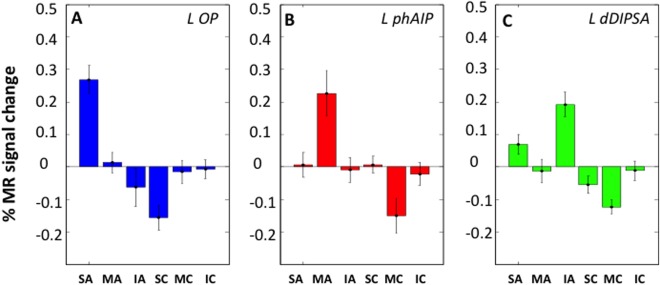
Figure 7.

Activity profiles of left OP (22 voxels, A), phAIP (33 voxels, B), and dDIPSA (10 voxels, C) sites (split analysis, see Methods). Vertical bars: standard errors (SEs). 2‐way ANOVAs: A: main effect video type F 1,25 = 23.1 (P < 10‐6), main effect of action class F 2,50 = 6.4 (P < 0.005), interaction F 2,50 = 30,3 (P < 10‐6); post hoc t tests skin‐displacing action condition > five other conditions (all P < 0.001); B: main effect video type F 1,25 = 9.5 (P < 0.005), main effect of action class F 2,50 = 4.2 (P < 0.05), interaction F 2,50 = 10.5 (P < 0.001); post hoc t‐tests: manipulative actions > five other conditions (all P < 0.01); C: main effect video type F 1,25 = 34.4 (P < 10‐6), main effect action class F 2,50 = 29.1 (P < 10‐6), interaction F 2,50 = 2.9 (P < 0.1), post hoc t‐tests: interpersonal actions > two other action classes (both P < 0.001).
