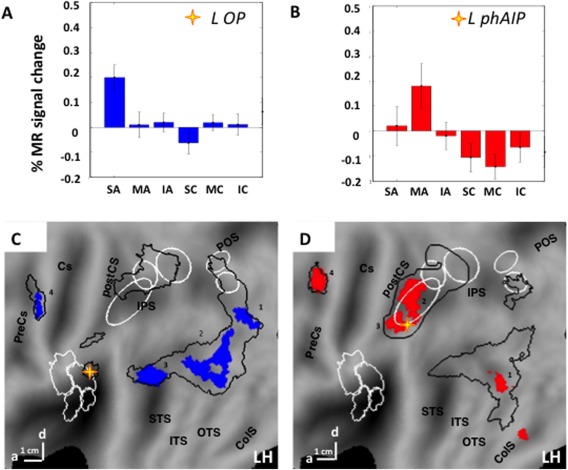
Figure 9.

PPI analysis of main experiment. Aand B average activity profiles of seed regions: OP (A, n = 21), left phAIP (B, n = 19); C and D: PPI maps of left phAIP (C) left OP (D) on flatmap of left hemisphere. Colored patches indicate regions reaching P < 0.001 uncorrected and numbers indicate significant sites (Table 3). In A and B vertical bars indicate SE. Stars in C, D: seed regions; Black outlines in C, D: activation maps (P < 0.01) for observing manipulation (C) and skin‐displacing actions (D), taken from Figures 3 and 4.
