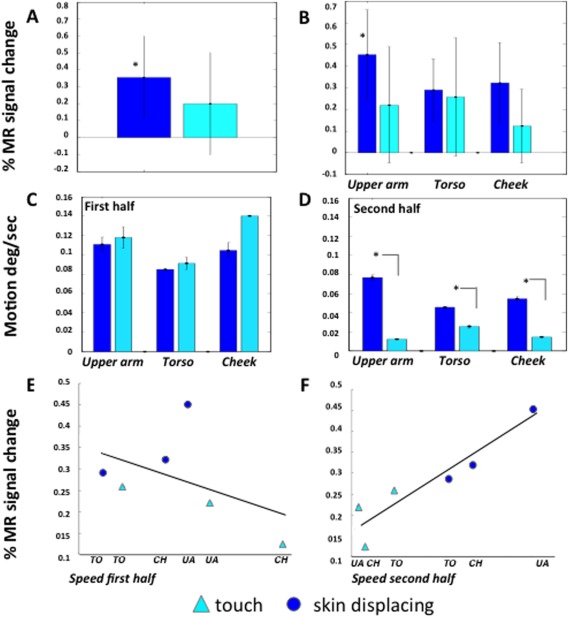
Figure 11.

Activity of OP site in control experiment: A, B: activity profiles (vertical bars: SE) for skindisplacing (dark blue) and touch (light blue) actions averaged over body regions (A) and for body regions separately (B).C, D: average seed in the first (C) and second half (D) of the videos for the six different conditions; E, F: correlation of OP activity with average speed in the first (E, r = −0.44, P > 0.3) and second (F, r = 0.93, P < 0.01) halves of the videos.
