Figure 4.

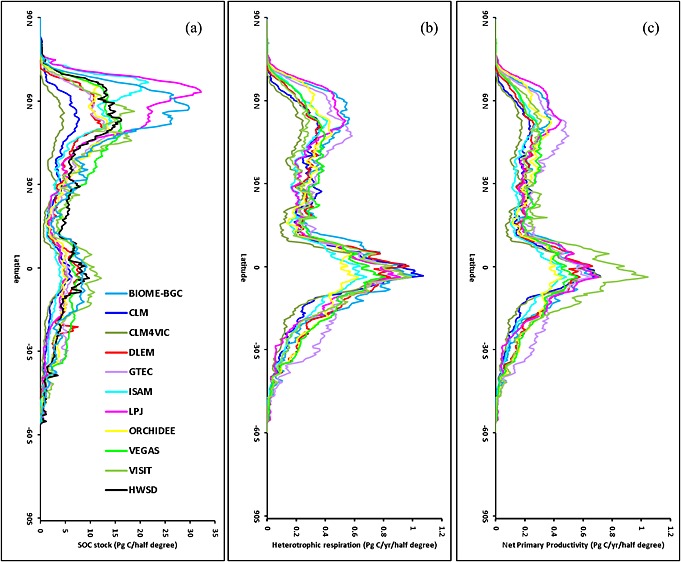
The estimated (a) SOC in the year of 2010, and (b) Rh, and (c) NPP averaged during the 2000s from 10 TBMs and Harmonized World Soil Database (HWSD) along 0.5° latitudinal band.

The estimated (a) SOC in the year of 2010, and (b) Rh, and (c) NPP averaged during the 2000s from 10 TBMs and Harmonized World Soil Database (HWSD) along 0.5° latitudinal band.