Figure 5.

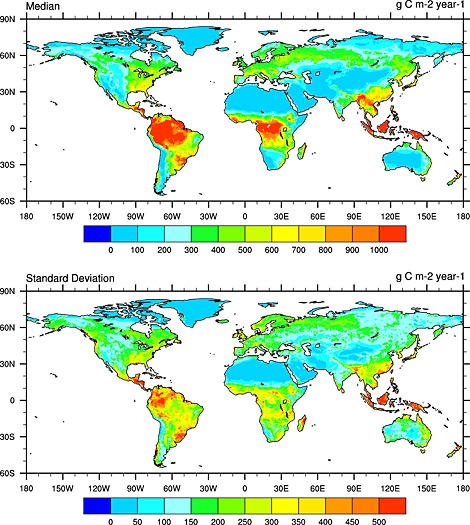
(top) The spatial distribution of median Rh (g C m−2 yr−1) in the 2000s as estimated by the 10 terrestrial biosphere models and (bottom) cross‐model standard deviation.

(top) The spatial distribution of median Rh (g C m−2 yr−1) in the 2000s as estimated by the 10 terrestrial biosphere models and (bottom) cross‐model standard deviation.