Figure 9.

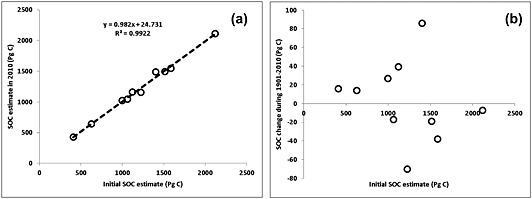
Dependence of contemporary SOC estimate in the year 2010 (a) and SOC change during 1901–2010 (b) on initial SOC estimate. Each circle denotes one model.

Dependence of contemporary SOC estimate in the year 2010 (a) and SOC change during 1901–2010 (b) on initial SOC estimate. Each circle denotes one model.