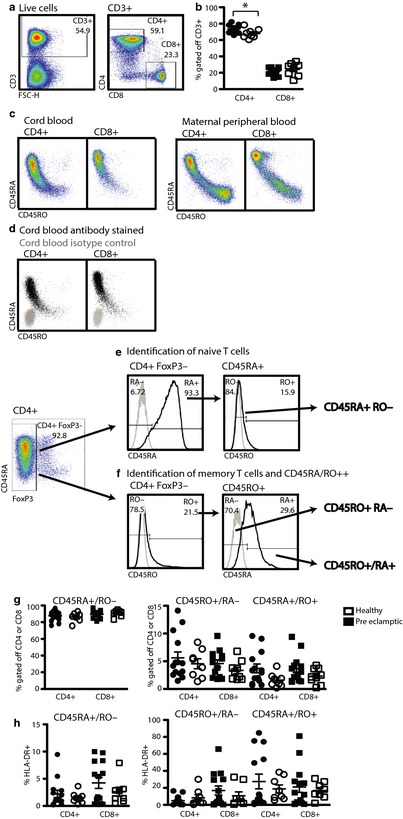
Figure 2.

CD4+ T cells in the cord blood of babies born to preeclamptic women are significantly reduced. Fresh cord blood samples from babies born to healthy 3rd trimester pregnant women and preeclamptic women were processed and analyzed as described in Materials and methods. (a) Gating strategy for the identification of CD4+ and CD8+ T cells. Starting with live lymphocytes as in Fig. 1e, live singlets are identified as in Fig. 1b. Gating for CD4+ and CD8+ T cells is depicted in the right hand side dot blot. (b) The percentage of CD4+ or CD8+ T cells within the total CD3+ population. Closed symbols: babies born to healthy mothers, open symbols: babies born to preeclamptic mothers. (c) Dot blot depiction of CD45RA and RO in CD4+ and CD8+ T cells of cord blood (left hand side) and maternal peripheral blood right hand side) (d) Dot blot overlay of antibody stained (black) or isotype control stained (gray) T‐cell populations (same sample as in 2c). (e+f) Gating strategy for the identification of three T‐cell subpopulations with distinct history. For the CD4+ population, only FoxP3‐negative T cells are analyzed. (e) CD45RA+ T cells are identified using a CD4+ T‐cell population stained with isotype control antibody (gray line, left hand side) to set a histogram gate including all CD45RA‐ antibody stained cells (black line, left hand side). Within this CD45RA+ population, CD45RO− T cells are identified using isotype control antibody stained cells (gray line, right hand side) to identify and exclude CD45RO− antibody stained cells (black line, right hand side). (f) Starting with the same population and similarly as in (e), CD45RO+ cells are defined as CD45RO+ in a histogram overlay of the isotype control stained cells (gray line, left hand side) with cells stained with CD45RO (black line, left hand side). Cells expressing CD45RO are analyzed for the absence or presence of CD45RA dividing them into two populations (right hand side). Based on the isotype control stained cells (gray line, right hand side), absence of CD45RA identifies CD45RO+ cells, while presence of CD45RA indicates CD45RO+/RA+ cells. (g) Percentage of the live cells identified as CD45RA+, CD45RO+, and CD45RA+/RO+ gated off the total CD4+FoxP3− or CD8+ population. (h) Percentage of HLA‐DR+ cells within the indicated populations. Student's t‐test, unpaired *P < 0.0174.
