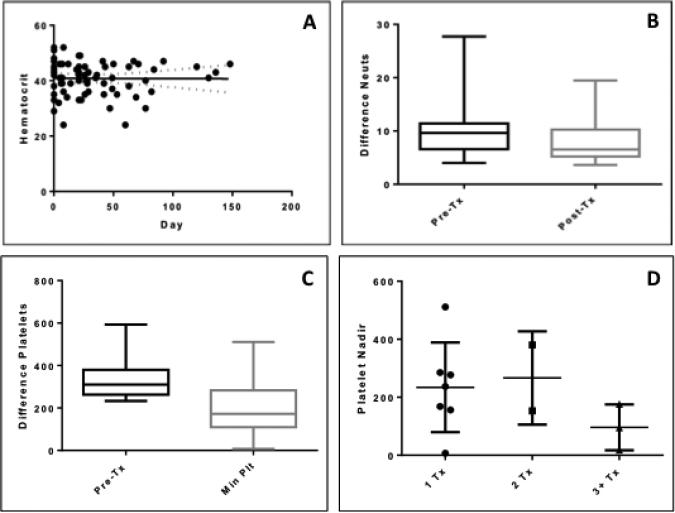
Figure 3.
A) Hematocrit test over time. The pre-dose value was collected on day 0. HA-Pt was given on day 1. Patients were monitored until the end of the study. The solid line represents the best-fit line using the linear regression model. The two dashed lines represent the confidence bands that define the 95% confidence interval of the best-fit line. A p value of 0.964 indicates that the slope of the best-fit line was not significantly non-zero, suggesting that the pre- and post-dose values were similar; B) Difference in neutrophil counts between pre- and post-treatment. The pre-dose values were collected on day 0, and the post-dose values were collected on day 4 to 148. Wilcoxon matched-pairs signed rank test indicated a statistically significant difference between pre- and post-treatment values (p=0.002); C) Platelet counts at pre-dose and nadir (minimum platelet counts). Wilcoxon matched-pairs signed rank test indicated a statistically significant difference between pre- and post-treatment values (p=0.001); D) Platelet nadir after one, two, or three plus treatments. Kruskal-Wallis test indicated platelet nadir was not correlated with the number of doses (p>0.05), suggesting that the increase in the number of treatments did not result in a decrease in platelet nadir.

