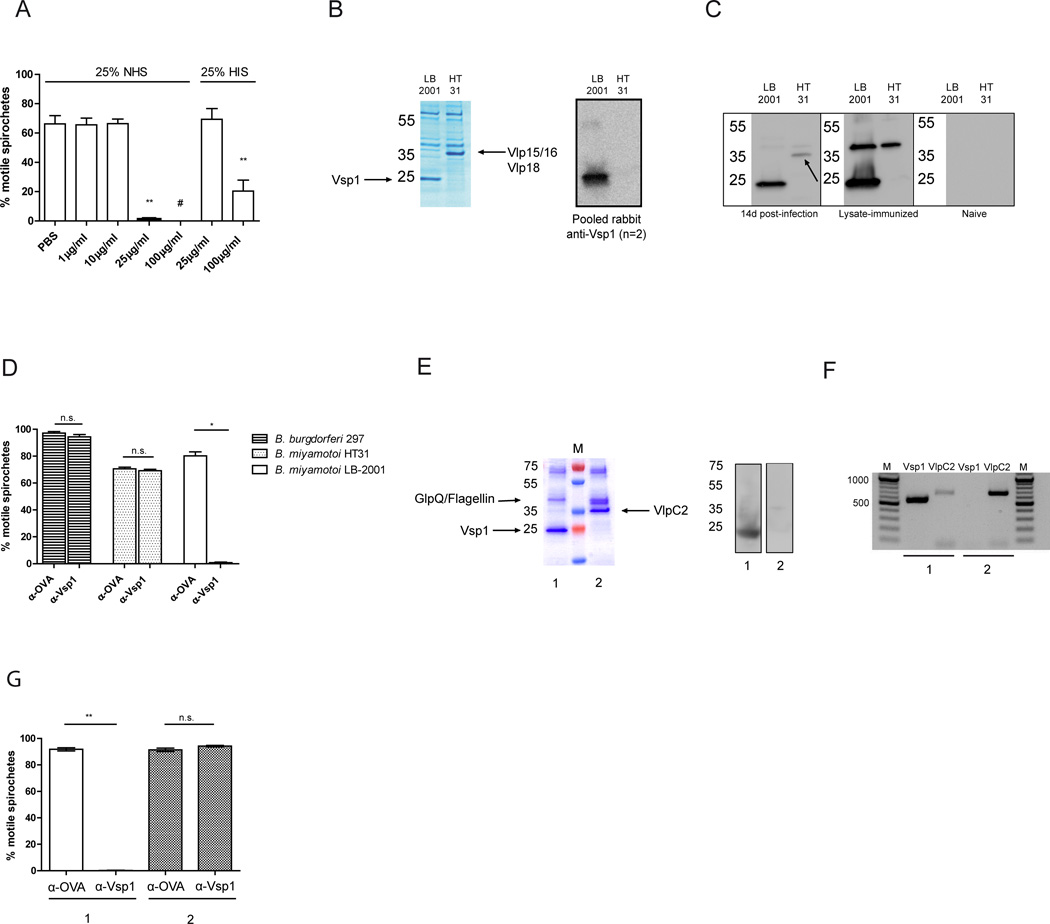
FIGURE 5. Vsp1 antibodies neutralize Vsp1-expressing B. miyamotoi spirochetes, and select for spirochetes expressing a Vlp.
(A) B. miyamotoi LB-2001 spirochetes were incubated with different concentrations of anti-Vsp1 IgG and 25% normal human serum (NHS) or 25% heat-inactivated serum (HIS). Five wells per condition were incubated at 37°C and 100 spirochetes per well were assessed by dark-field microscopy. A representative of three independent experiments is shown. (B) Coomassie blue staining of B. miyamotoi LB-2001 (expressing Vsp1), and of isolate HT31, expressing a ~37 kDa protein band which by mass-spectrometric analysis was revealed to contain Vlp15/16 and Vlp18 (left panel). Western blot analysis of Vsp1 expression in LB-2001 and HT31 lysates (right panel). (C) Western blot analysis of LB-2001 and HT31 lysates using pools of sera from 4 mice infected for 14 days with B. miyamotoi LB-2001 (left strip), mice actively immunized with B. miyamotoi LB-2001 lysate (middle strip), or naive mice (right strip). A band containing Vlp15/16 and Vlp18 in B. miyamotoi HT31 lysate is indicated by an arrow. (D) Killing assay performed using 100µg/ml anti-Vsp1 IgG (α-Vsp1) or a control antibody (α-OVA) and 25% NHS, on B. burgdorferi 297, B. miyamotoi HT31 and B. miyamotoi LB-2001. The graph is a representative of three independent experiments. (E) Coomassie blue staining of B. miyamotoi lysate 1, derived from B. miyamotoi LB-2001 previously challenged with α-OVA, and lysate 2 derived from spirochetes surviving a challenge with α-Vsp1 (E, left panel). M: Protein marker. Vsp1 expression in lysate 1 and 2 as determined by western blot using Vsp1 antiserum (E, right panel). (F) PCR on DNA extracted from isolates 1 and 2 (α-OVA and α-Vsp1 challenged, respectively) performed using an expression site promoter-specific forward primer and reverse primers for Vsp1 or VlpC2. M: Marker indicating number of base pairs (bp), with 100 bp increments. (G) Second challenge with 100µg/ml α-Vsp1 or α-OVA + 25% NHS performed on representative spirochete cultures 1 and 2 (which dominantly express Vsp1 and VlpC2, respectively). * p<0.05, ** p<0.01. # Chi squared test, p=0.002. Error bars illustrate mean ± S.E.M.

