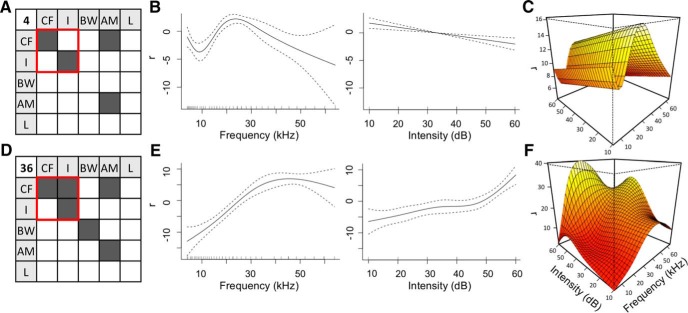
Figure 1.
Presence of an interaction term. Significance matrices, 1-dimensional response curves, and CF-I response surface of (A-C) Neuron #4 and (D-F) Neuron #36. A, D, Significance matrices represent significant (p < 0.05, shaded dark) individual dimensions on the diagonal and interaction terms in the upper triangle. (The lower triangle is symmetric to the upper triangle and not shaded.) Red box represents the terms being considered in the 1- and 2-dimensional visualizations. B, E, One-dimensional response curve of each neuron with respect to CF (left) and I (right). Dashed lines indicate the confidence interval as ±2× SE. C, F, CF-I response surface of each neuron.

