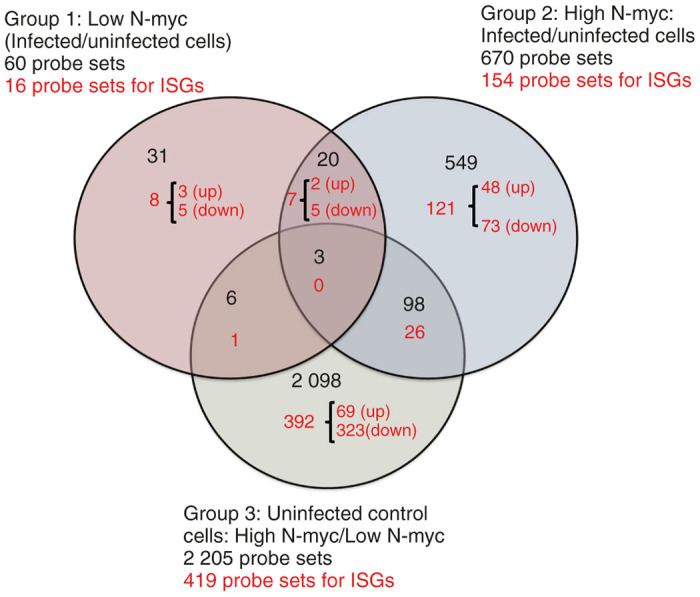
Figure 4.

Comparison groups for microarray analysis. Comparison groups are illustrated in a Venn Diagram generated from Affymetrix GeneChip array. Analysis of variance, P < 0.05, was applied as statistically significant. Fold changes of ≥ 1.5 and ≤−1.5 were included in the analysis. The numbers in black correspond to the total probe sets. Numbers in red correspond to the total of probe sets for interferon-stimulated genes (ISGs) identified in the Interferome database.32 Up, upregulated ISGs; down, downregulated ISGs.
