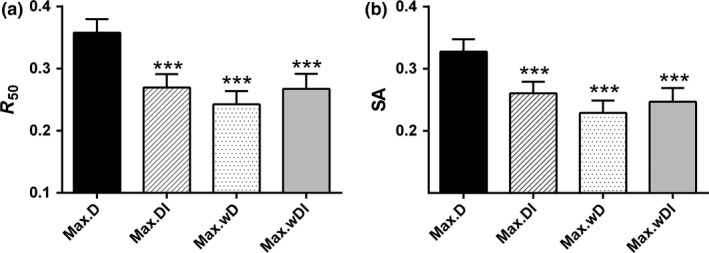
Figure 1.

Stability of the 20 food webs to species loss in four deletion sequences (mean ± SEM). Here, stability is represented by (a) robustness, R 50, the fraction of taxa that have to be removed to induce ≥ 50% total taxon loss, and (b) survival area, SA, the area under the curve resulting from plotting the number of surviving taxa. The stars directly above the error bars denote significant differences in stability between the focal deletion orders and the control order (Max.D): *** P < 0.001.
