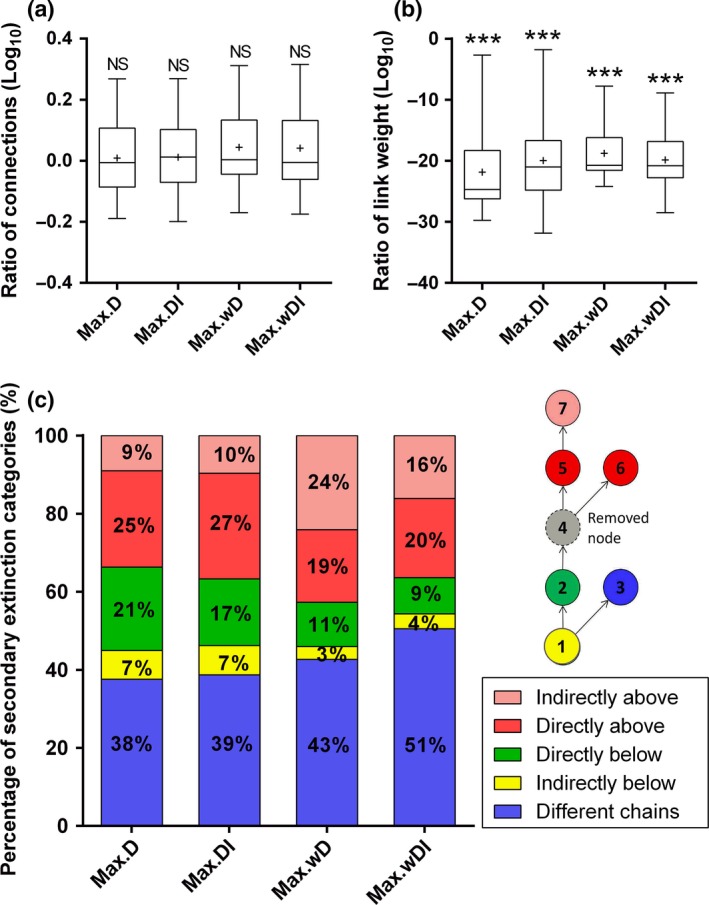
Figure 2.

(a–b) Comparison of the types of nodes that went secondarily extinct with those surviving. The nodes going secondarily extinct were significantly different (denoted by stars) from the surviving nodes in (a) number of links or (b) link weight if the confidence intervals around the logarithm of the ratio between the value of the secondarily extinct nodes and the average value of all surviving nodes did not overlap with zero. (c) Trophic categories of nodes that caused the secondary extinctions. The percentage of secondary extinctions for each trophic category across the 1000 simulations of all 20 food webs is shown, along with an illustration of what each of the trophic categories imply.
