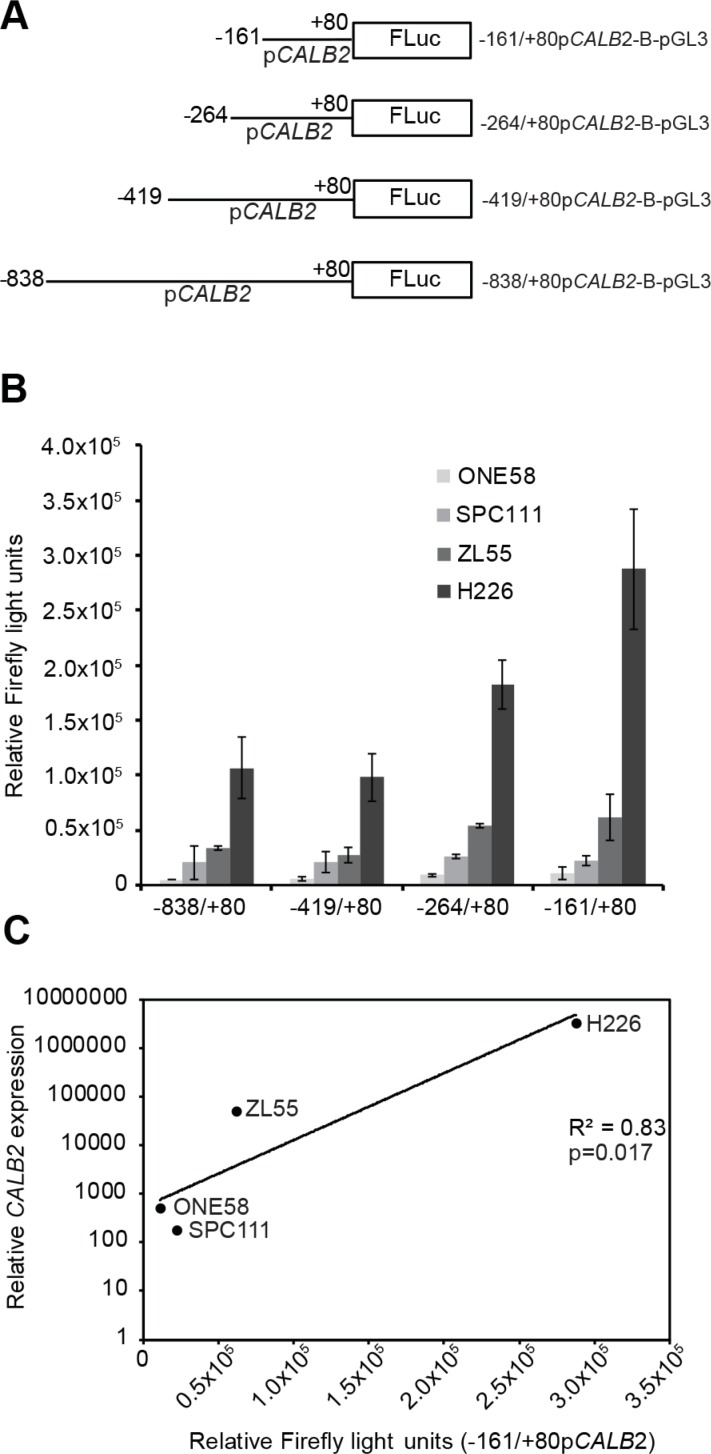
Figure 3. Transcriptional activity of the minimal CALB2 promoter is proportional to calretinin expression.
Transcriptional activity of different promoter constructs was assessed by transient transfection and dual luciferase assay using pTK-RL as an internal control. (A) 5′-deletion constructs of the CALB2 promoter engineered in the pGL3-basic (pGL3-B) luciferase reporter plasmid. Lines represent CALB2 promoter fragment; the name and the size are indicated by nucleotide position upstream (−) or downstream (+) relative to the transcription start site (+1). (B) CALB2 promoter activity in ONE58, SPC111, ZL55 and NCI-H226 cells, which express different levels of calretinin. To allow for comparison of the absolute promoter activity between the cell lines, Firefly light units were multiplied by a correction factor that compensates for differences in the transfection efficacy. The correction factor was based upon the Renilla Light Units (ReLU) of the internal control, pTK-RL, and was calculated by dividing the mean ONE58 ReLU by the mean of ZL55, SPC111 and H226 ReLU for each construct. Mean ± SD, n = 3. (C) Relative mRNA abundance is plotted versus the relative Firefly light units reflecting absolute −161/+80bp CALB2 activity for the indicated cell lines.

