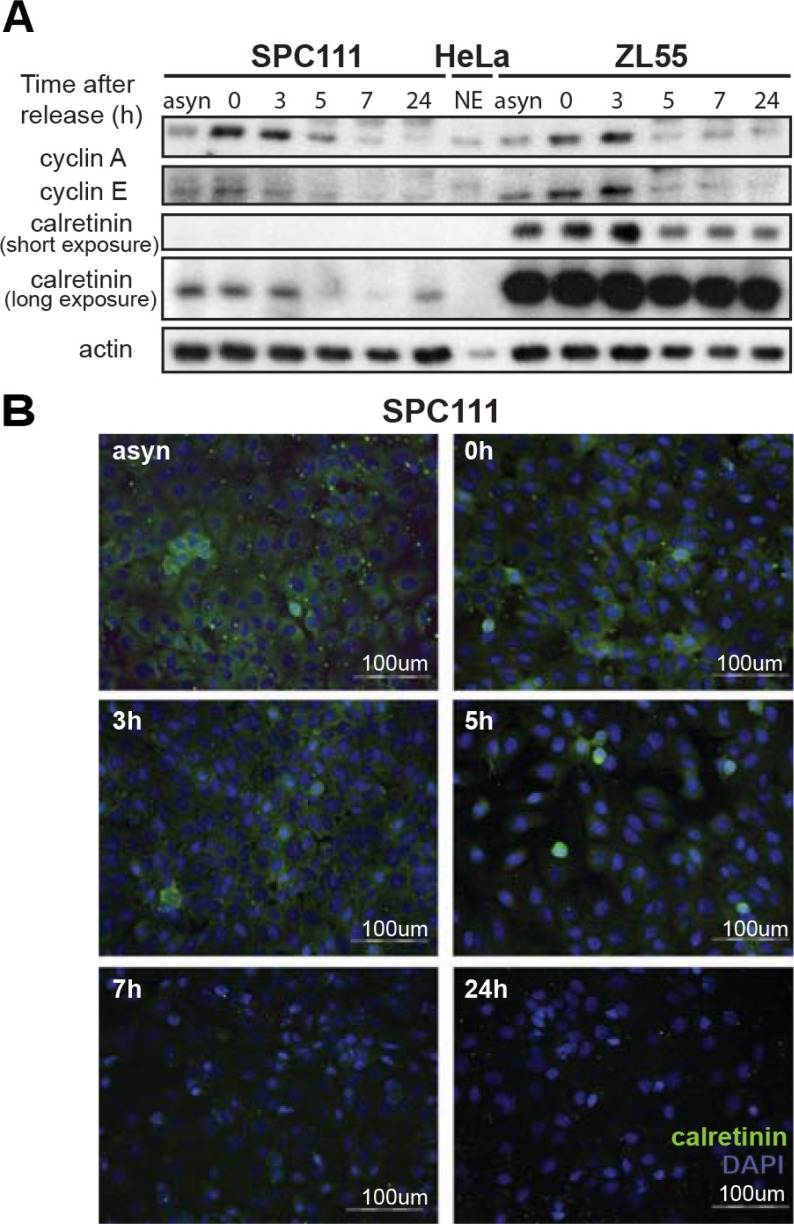
Figure 6. Cell cycle-dependent regulation of calretinin expression.
(A) Calretinin levels in protein lysates from ZL55 and SPC111 synchronized cells collected at different time points (0 h, 3 h, 5 h, 7 h, 24 h) after removal of thymidine block. Analysis of cyclin A and cyclin E expression was used as a reference for cell cycle progression. A nuclear extract of HeLa cells is used to identify the position of the bands of cyclin A and cyclin E Due to the considerably different calretinin expression levels of ZL55 and SPC111 cells, two different exposure times are presented. (B) Immunofluorescence analysis of SPC111 cells using calretinin antibody (green) at the same time points as in (A) Cells nuclei are stained with DAPI (blue), and calretinin immunofluorescence is shown in green.

