
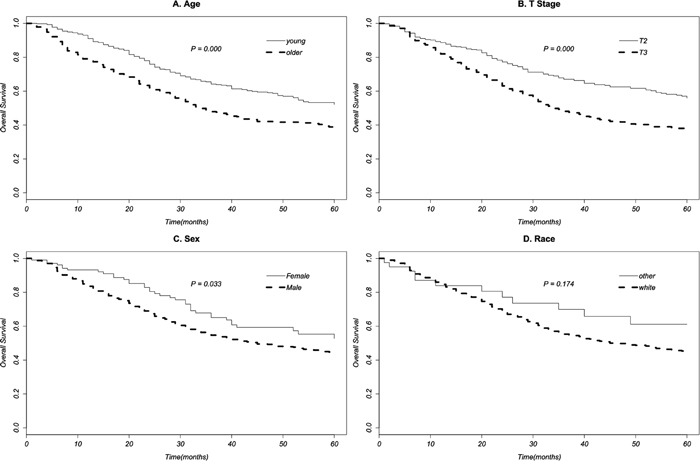
Figure 1. Survival curves of age A. T stage B. sex C. race D. to patients of T2-3N0M0 stage EAC.
Official websites use .gov
A
.gov website belongs to an official
government organization in the United States.
Secure .gov websites use HTTPS
A lock (
) or https:// means you've safely
connected to the .gov website. Share sensitive
information only on official, secure websites.