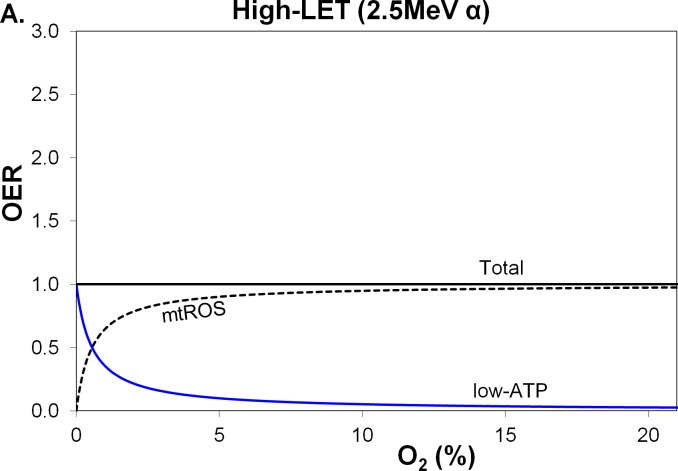
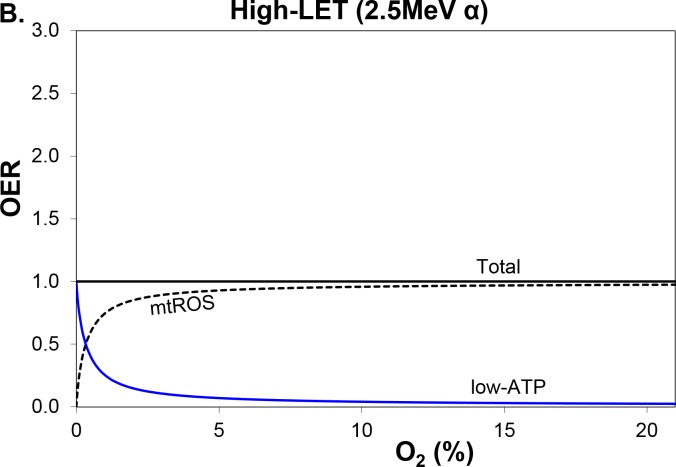
Figure 3. Variation in total OER and its components, with percentage O2 in air, for high-LET 2.5 MeV α-particles.
The blue line and black-dashed line are the 2 OER components, low-ATP and mtROS, comprising the black line for unchanged total OER. MtROS trends appear virtually the same for A. radiation-induced mtROS proportional to O2 flux and B. fractional mtROS decreasing with O2 flux (total OER is unchanged).


