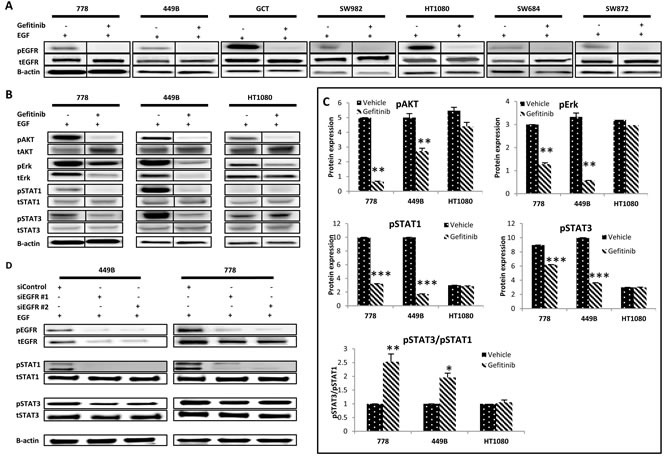
Figure 2. Effect of EGFR targeted monotherapy using either gefitinib or anti-EGFR siRNA on selective signalling markers in wild type STS cell lines.

A. EGFR alteration and phosphorylation followed by gefitinib treatment in a panel of seven STS cell lines. Representative images of Western blot detection of tEGFR and pEGFR Tyr1068 before and after treatment with gefitinib (10 μM) for 24 hours with or without EGF stimulation. B. Representative images of Western blot detecting pAKTSer473, pERKThr202/Tyr204, pSTAT1Tyr701 and pSTAT3Tyr705 and their total proteins after treatment with vehicle control (0.08% DMSO) or gefitinib (10 μM) for 24 hours with EGF (100 ng/ml, 15 minutes). C. Western blot images (duplicate) were quantified using ImageQuant software. Phosphorylated proteins pAKT, pERK, pSTAT1 and pSTAT3 were normalized to the corresponding β-actin. D. At 48 hours post-transfection of siEGFR, cells were harvested for Western blot analysis. Point: mean of duplicate data. Error bar: standard deviation (SD). * p ≤ 0.05, ** p ≤ 0.01.
