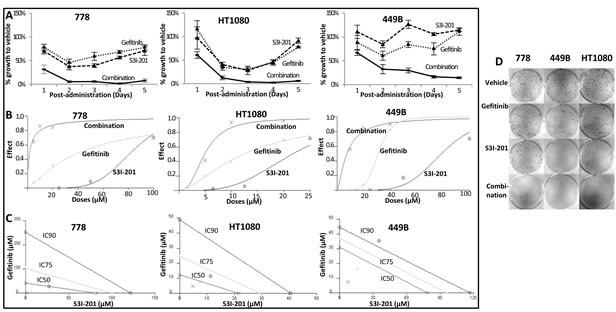
Figure 3. Sarcoma cell lines 778, HT1080 and 449B achieved synergistic anti-proliferative effect after combination treatment with gefitinib and S3I-201.

A.-C. Quantitative data from crystal violet assay were analysed by CalcuSyn software. A. Growth curves; B. Dose effect curves: the effect was a measure of the relative inhibition compared to vehicle control following treatment; C. Isobolograms: For a given effect level, the axes represent the required combination therapy doses for IC50, IC75 and IC90. If the combination point at each IC level falls on the diagonal line, an additive effect is achieved; if it falls on the lower left of the diagonal, a synergistic effect is achieved, and if it falls on the upper right of the diagonal, an antagonistic effect is achieved. D. Clonogenic assay in STS cell lines treated with gefitinib (10 μM), S3I-201 (5 μM) or combination of both drugs. After colonies formation (more than 50 cells), cells were stained with crystal violet to determine the presence of colonies.
