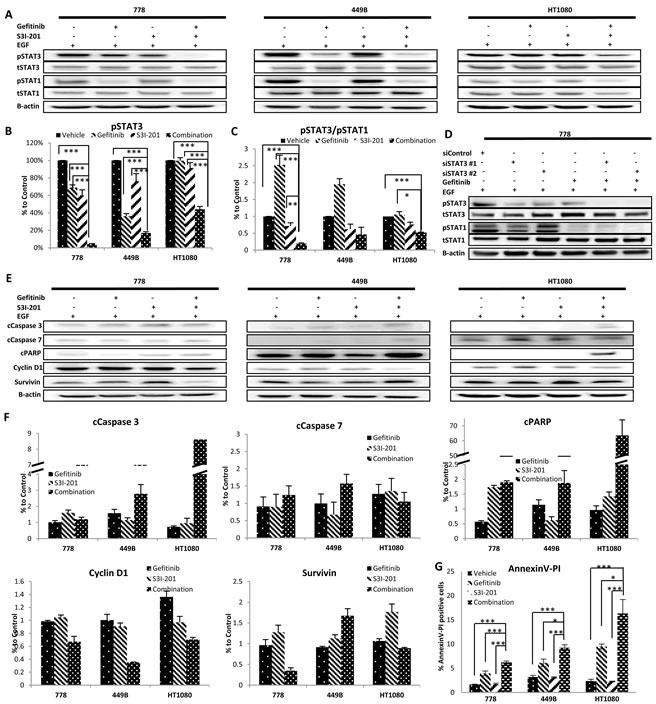
Figure 4. Combination therapy using gefitinib and S3I-201 induced further inhibition of pSTAT3, reduction of pSTAT3/pSAT1 and induced apoptosis and cell cycle arrest.

A. Representative images of Western blot analysis of total (t) and phosphorylated (p) STAT3 and STAT1 before and after treatment with gefitinib (10μM) and/or S3I-201 (25μM) for 24 hours in the presence of EGF on three wild type STS cell lines. B.-C. Data from at least triplicate experiments were quantified using ImageQuant software. The pSTAT3 expression in individual cell lines in the presence of EGF was normalized to β-actin and shown as percent (%) expression of post versus pre-treatment, as well as the ratio of pSTAT3/pSTAT1. D. At 24 hours post-transfection of anti-STAT3 siRNA, cells were treated with 10μM gefitinib. After incubation for 24 hours, cells were harvested for Western blot analysis. E. Representative imaging of Western blot of (from top row to bottom) cleavedC. Caspase-3, cCaspase-7 and cPARP, Cyclin D1 and Survivin before and after treatment with gefitinib and/or S3I-201 for 24 hours with EGF in 3 STS cell lines (778, 449B and HT1080). F. Data from at least triplicate experiments were quantified using ImageQuant software. All proteins with EGF stimulation were normalized to β-actin and were shown as percentage (%) expression of post/pre-treatment. G. Cells were treated with vehicle control (DMSO), gefitinib and/or S3I-201 for 24 hours and subjected to Annexin V/PI (propidium iodide) staining and flow cytometry. Error bar: standard deviation (SD). Error bar: standard deviation (SD).* p < 0.05, ** p < 0.01, *** p < 0.005.
