
Figure 2. Kaplan–Meier and ROC curves for the six microRNA signature in TCGA HNSCC cohort.
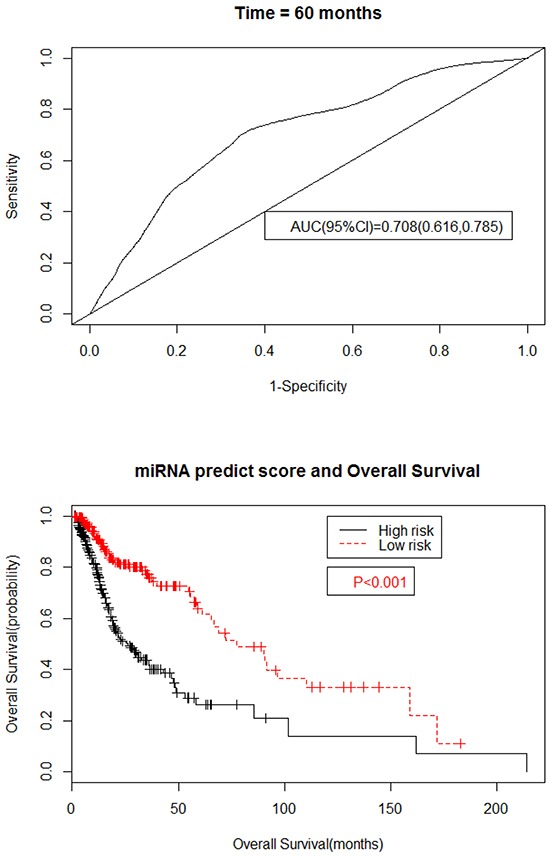
A. The ROC curve for predicting 5-year survival had an AUC of 0.708 (95%CI, 0.616-0.785). The 95%CI of AUC were calculated from 1000 bootstrap of the survival data. B. The Kaplan–Meier curves for HNSCC risk groups obtained from the TCGA cohort divided by the cutoff point. The P value of the log-rank test was <0.01.