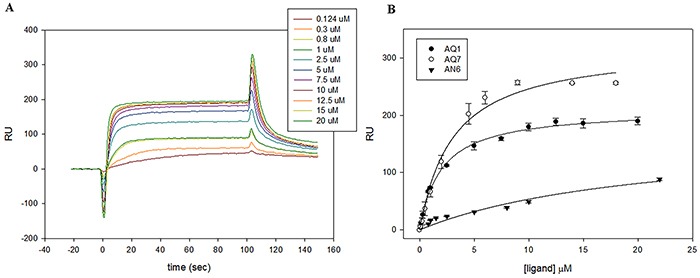
Figure 3. Representative examples of SPR analysis.

A. Sensorgrams derived from the analysis of AQ1 with KIT2. B. Plots of the RU at the steady state plotted vs the concentration of injected ligand on chip functionalized with KIT1.

A. Sensorgrams derived from the analysis of AQ1 with KIT2. B. Plots of the RU at the steady state plotted vs the concentration of injected ligand on chip functionalized with KIT1.