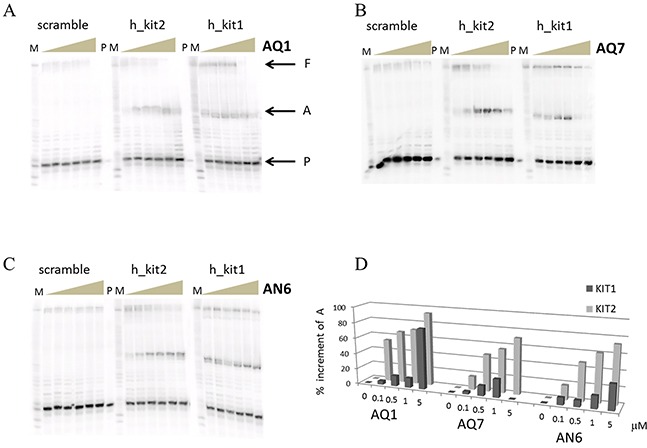
Figure 4. Polymerase stop assay performed with increasing concentration (0-10 μM) of AQ1 A. AQ7 B. or AN7 C.

Letters P, A and F respectively correspond to primer, arrest product and full length product, while M indicates the purine markers obtained according to the Maxam and Gilbert protocol from the full length product. In D. the quantification of the arrest product is reported. Errors were ± 10%.
