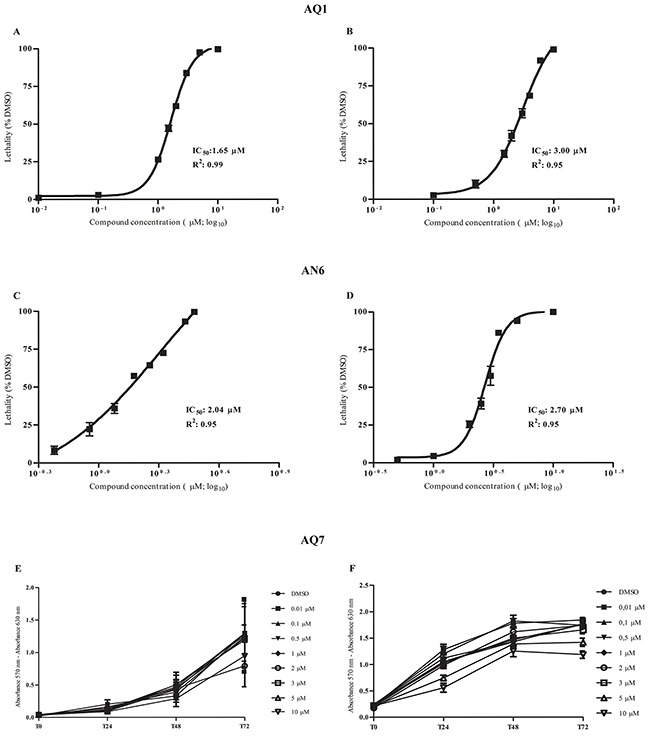
Figure 5. Dose-response and proliferation curves of HGC27 and MCF7 after treatment with the G4-ligands.

A. HGC27 and B. MCF7 dose-response curves from Alamar Blue experiments to determine IC50 values and R2 following the incubation with AQ1. C. HGC27 and D. MCF7 dose-response curves from Alamar Blue experiments to determine IC50 values and R2 after the exposure to AN6. E. HGC27 and F. MCF7 proliferation curves from sulforhodamine B experiments following the incubation with AQ7. Data are expressed as mean values ± standard deviation of three independent experiments, each one performed in different culture passages.
